
Look up the climate for a certain place you’d like to visit, and you’ll find long-term averages of temperature, rainfall, snowfall, humidity, and the like. Properly, “long term” implies at least 30 years.
When climatologists talk about “the climate,” they refer to such data averaged all over the planet. Phenomena such as a hot spell in New England, a whole season of hotter weather than average in the Great Plains, or “atmospheric rivers” causing unusual flooding in California are local weather events, not changes in local climate, and certainly not changes in planetary climate.
Figure 1 shows the worldwide temperature anomaly as measured by satellite. There is an abrupt rise in mid-2023, coincident with the El Niño; the surface temperature of the tropical Pacific (120° west to 165° west) rose 3°C between October 2023 and December 2024. La Niña conditions are expected to return by July or August.
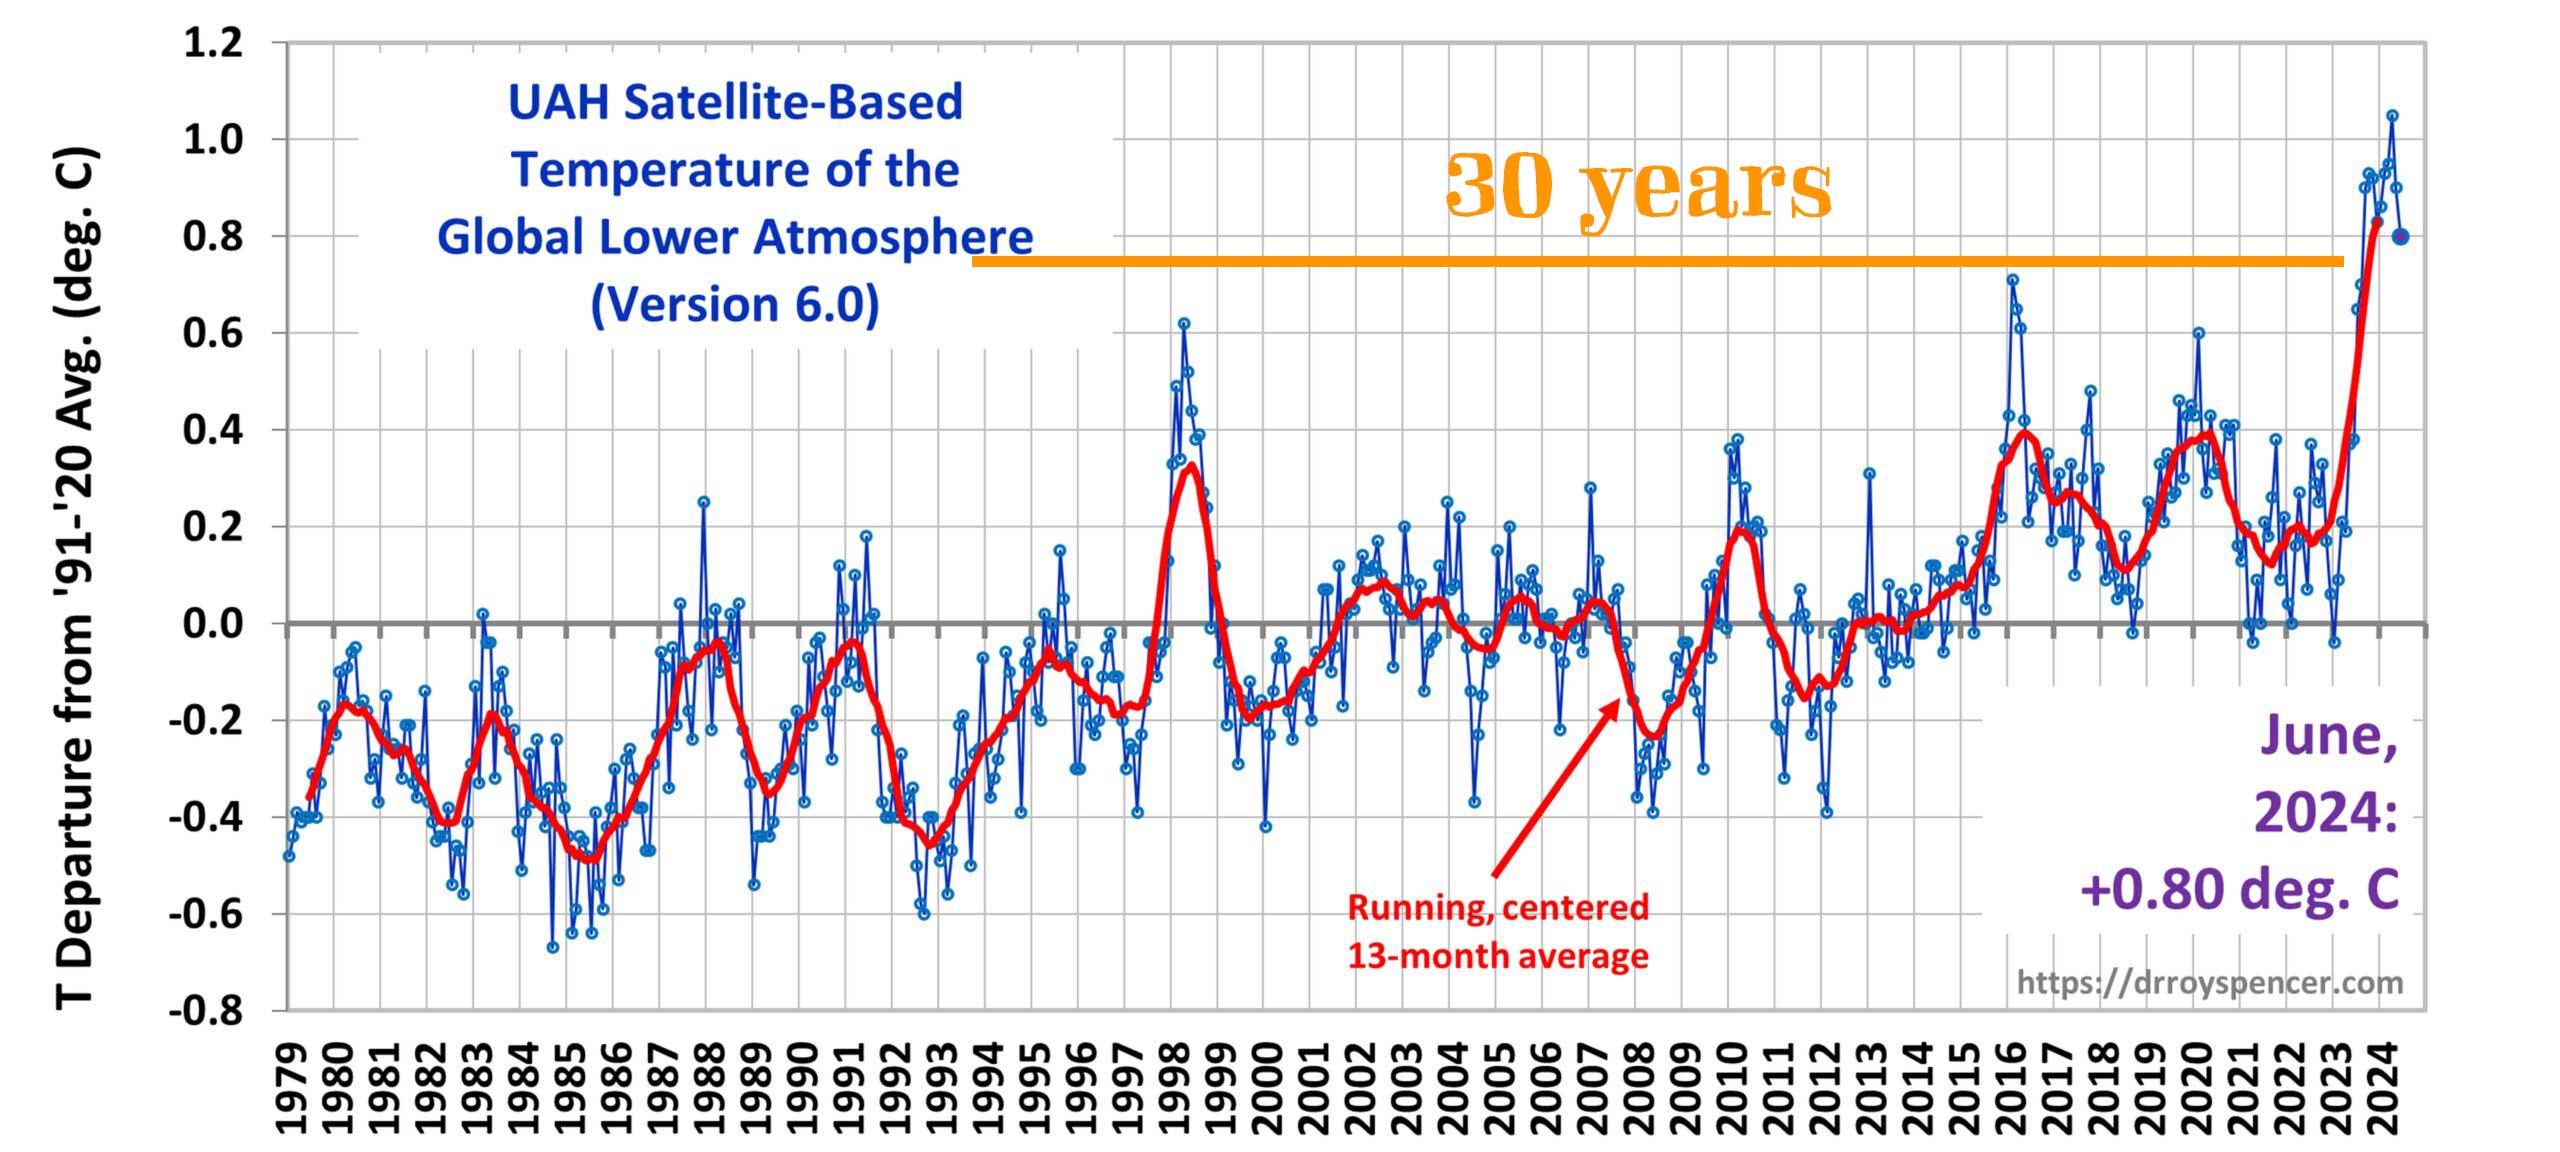
Have a close look at Figure 1. In 30 years, there are 360 monthly data points. About 7 of them are in the current peak. How much effect on the 30-year average do they have? They raise the average by about 0.015C.
There is another way of looking at Figure 1. From December 1979 until December 2009 is 30 years. From then until December 2039 will be another 30 years. That is, by the end of 2039 there will be a total of two (count them: 2) climate data points in the satellite record.
Brief History of the “Climate Crisis”
Given the amount of sunlight reaching the surface of the earth and the approximately known average temperature, scientists in the late 1800s were able to deduce that the surface was warmer than it “should be,” so they correctly concluded that the atmosphere played an important role. With crude measurements of infrared (IR) intensities, they concluded that absorption by H20 and CO2 contributed to the surface heat.
Historical climatology has many sources of information, such as records of crop failures and abundances, cave writings in China, and depictions on walls in pyramids. Paleontology tells of large mammals living in the Arctic. Fossils of huge ferns and dinosaur bones also tell about climate. More modern measurements of oxygen and hydrogen isotopes in ice cores present a history of climate temperature. Carbon dating, combined with tree-ring dating, provides us with a history of the solar wind. In the words of late Canadian climatologist Tim Ball, “Climate is a generalist subject.”
All of the above was just a scientific endeavor, an academic pursuit.
For many people, awareness of the climate began with Al Gore’s 2006 movie An Inconvenient Truth, so we will begin our story there.
One of the iconic pictures showed Mr. Gore parading in front of a huge screen that showed a graph of the temperature of the earth and the atmospheric carbon dioxide (CO2) concentration going up and down together for the better part of a million years. He implied that even a fool could see that changes in CO2 caused the temperature to change.
The messages for the public were that (A) the world is rapidly becoming hotter; and (B) that CO2 from human activities is the cause of the climate disaster.
Questions the “Climate Scientists” Have Failed to Ask
So, the world is supposedly rapidly overheating and leading to disaster; and it is due to human activity.
It requires no special knowledge of climate, but curious scientists would surely ask these questions:
- Where did the CO2 come from to cause the temperature to rise?
- Where did the CO2 go to cause the temperature to fall?
- What caused the CO2 changes in the first place?
Where were the “climate scientists?”
Were these simple questions raised by James Hansen, Michael Mann, Gavin Schmidt, Kevin Trenberth, Katherine Hayhoe, Phil Jones, or any other notable “climate scientist” known to the news media?
Not a chance.
“It is difficult to get a man to understand something when his salary depends upon his not understanding it.”
Upton Sinclair (1878–1968)
Historical climatologists have long known the history behind the temperature graph. A Serbian mathematician and astronomer named Milutin Milankovitch (1879-1958) studied the graph and concluded that it was composed of several different cycles.
The prominent one lasted 100,000 years. Second in importance was a cycle of 43,000 years, and the third was one of 24,000 years.
As Milankovitch knew, these were the periodicities of some important aspects of the earth. The shape of our orbit around the sun varies from almost circular to a more elliptical shape, characterized by a number called the eccentricity, with a period of 100,000 years. The earth’s axis of spin (the line running through the south and north poles) is presently tilted about 23.5° but that angle changes by about a degree each way with a period of 43,000 years. The angle is called the obliquity. Finally, that axis sweeps around a huge circle, rather like that done by a spinning top, with a period of 24,000 years. The process is called precession.
We will leave the details to astronomers. What is important is that Milankovitch, along with later scientists, succeeded in matching the historical swings in temperature with the Milankovitch cycles, concentrating on how much sunlight there was at 65° north latitude. All of this was known to climatologists at the time Mr. Gore produced An Inconvenient Truth. We heard not a peep from the “climate scientists.”
Where were the “climate scientists”?
When one sees a correlation between A and B, the natural question to ask is, “Does A cause B, does B cause A, does something else cause A and B, or is the correlation accidental?”
In the case of CO2 and climate in the ice record, that answer is partially answered by a close look at the data.
In this case, the CO2 changes occurred after the temperature changes; therefore, the CO2 changes cannot be the cause of the temperature changes. See:
“High resolution records from Antarctic ice cores show that carbon dioxide concentrations increased by 80 to 100 parts per million by volume 600 400 years after the warming of the last three deglaciations.”[1] [emphasis added.]
James Hansen, Michael Mann, Gavin Schmidt, Kevin Trenberth, Katherine Hayhoe, Phil Jones, and all other notable “climate scientists” known to the news media were silent.
Where were the “climate scientists?”
In the IPCC’s Third Assessment Report (TAR) Table 6.2 on page 358 tells us a formula for calculating the “radiative forcing” from the CO2 concentration C given a starting value Co:
∆F = 5.35 (W / m2) ln (C / Co)
The formula is taken to be a good approximation within a factor of two either way, given the value of 369 ppmv in 2001, the date of the TAR.
So, the radiative forcing since the last glacial maximum (LGM) when the CO2 concentration was 180 ppmv amounts to 3.8 W/m2. The temperature rise since then is 10°C. So, the surface of our planet is now radiating about 55 more W/m2 than it did at the LGM. How could an increase in the ability to stop 3.8 W/m? possibly hold back the 55 W/m2 increase in surface IR emission? And how could 2 W/m2 of CO2 forcing retain 6 W /m2 due to 1.1°C of surface warming since the “pre-industrial period” of 1850-1900?
James Hansen, Michael Mann, Gavin Schmidt, Kevin Trenberth, Katherine Hayhoe, Phil Jones, and all other notable “climate scientists” known to the news media have been silent.
Where were the “climate scientists?”
Earth’s temperature and the atmospheric CO2 concentration have been correlated for the last half-million years, but that’s an exception to the 600-million absence of a correlation, as shown in Figure 2. All of this was known in 2001, well before An Inconvenient Truth.
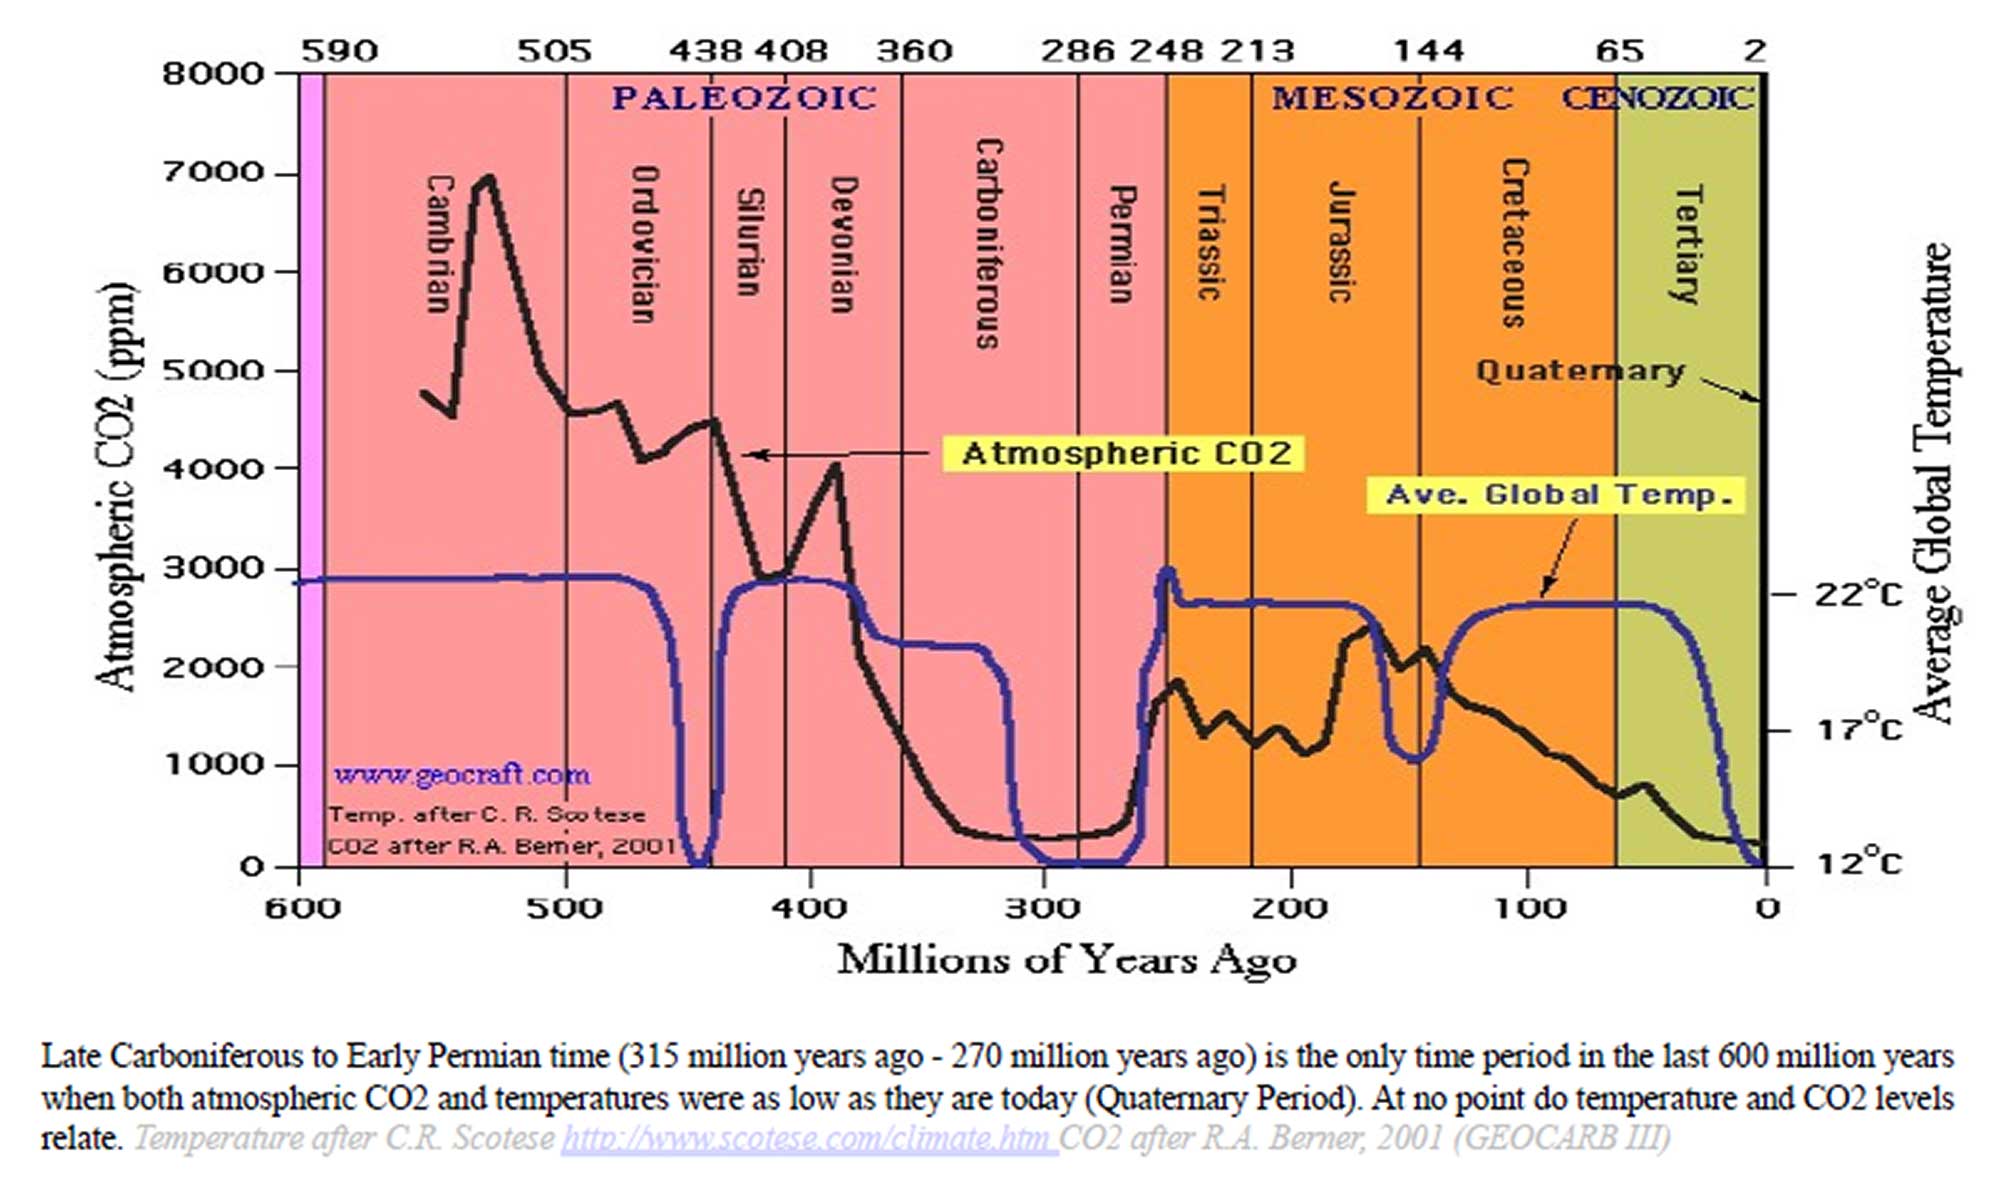
Were there any comments from the world’s leading climatologists about this lack of correlation? Did anybody at the IPCC, The American Meteorological Society, the American Geophysical Union, The National Academy of Sciences, or the American Association for the Advancement of Science (AAAS) happen to notice that the ice-ball earth of ca. 450 million years ago had a COz concentration of about 4,000 ppmv, 10 times our present value?
Where were the “climate scientists?”
In brief, the essence of the greenhouse effect is that the IR leaving the surface follows the blackbody curve, a smooth graph of intensity versus wavelength, but the spectrum of IR going to space is a jagged curve with bites of the blackbody spectrum taken out at the wavelength bands of H2O, CO2, O3, and two even more minor gases NOz and CH4. In a simple drawing, the question is how the atmosphere changes the spectrum, as shown in Figure 3. The details of the spectral change need not concern us here, but let us ask what scientific courses in college or graduate school would be required to learn how to analyze that spectral change. A course in spectra answers part of the question: what GHGs absorb how much IR in what wavelength bands?
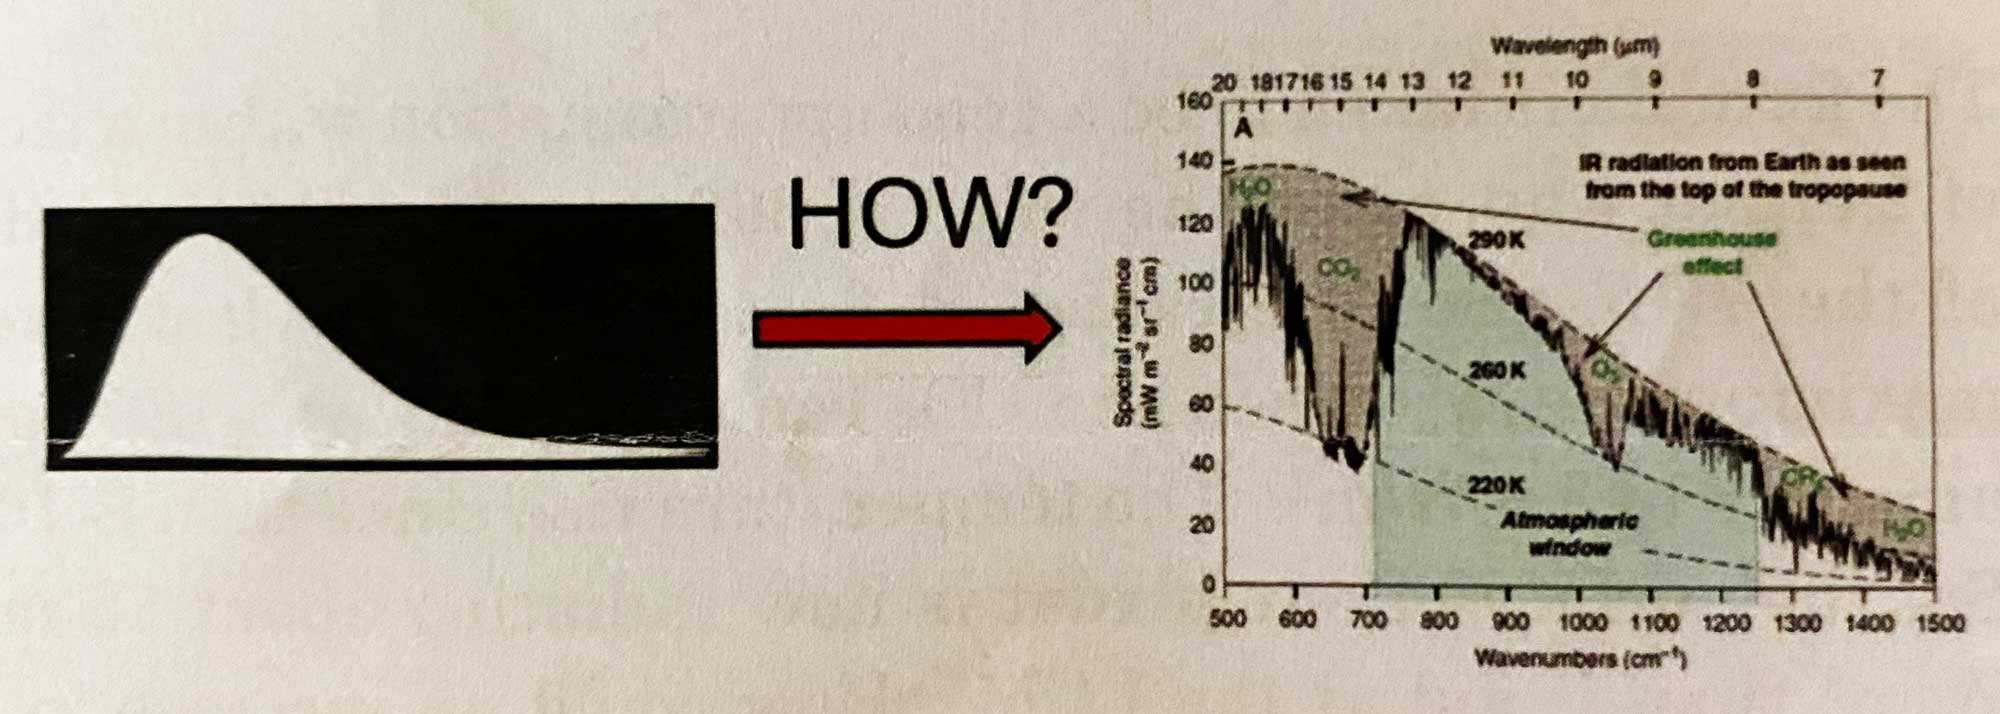
Knowing the spectral details of the greenhouse gases (GHG) is not enough, however. There is also IR emission by the GHGs to contend with, and both absorption and emission are temperature and pressure-dependent. These matters are to be found in a course in Statistical Mechanics, a high-level thermodynamics course.
It is a rare university Department of Climatology or Meteorology that offers either subject listed. Expertise in Spectroscopy and in Statistical Mechanics is far more likely found in departments of Physics and Chemistry.
When we hear of the “97% consensus” about climate, and “everybody agrees,” the reference is to “climate scientists” who have been properly trained in departments of Climatology of Meteorology, especially if they publish articles.[2]
Actual experts in the subjects relevant to the infrared spectrum (such as, but not limited to, William Happer and William van Wijngaarden are not considered “climate scientists,” even if their list of scientific publications is as long as your arm.
[1] Hubertus Fischer, Martin Wahlen, Jesse Smith, Derek Mastroianni, Bruce Deck, “Ice Core Records of Atmospheric COz Around the Last Three Glacial Terminations,” Science, vol. 283. no. 5408, pp. 1712 – 1714 (12 March 1999.) See also Nicolas Caillon, Jeffrey P. Severinghaus, Jean Jouzel, Jean-Marc Barnola, Jiancheng Kang, Volodya Y. Lipenkov, “Timing of Atmospheric CO2 and Antarctic Temperature Changes Across Termination III,” Science, vol. 299, no. 5613, pp. 1728 – 1731 (14 March 2003)
[2] Naomi Oreskes, “The Scientific Consensus on Climate Change,” Science, 306: 5702, p. 1686, 3 December 2004